Module description
The Tech Upgrade Course consists of four modules.
Module one:
Strategic Overview
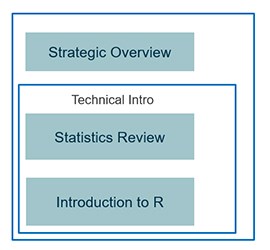
We will start the techUpgrade with a nontechnical introduction to the world of data analysis. Which tools are out there? What techniques are being used? A small refresher in the statistical methods necessary for the later parts follows. This refresher will bring you back up to speed on a number of essential methods in a practical and applied way.
Finally, you will receive an introduction to R. R has emerged as the most important statistical programming language. Because of its open source nature, R has become a central backbone of modern data analysis and it covers all relevant areas of data analysis for us.
We will also discuss practical areas of data analysis here, such as research reproducibility.
Core Data Analysis
Almost every firm has small data available: information from CRM systems, data from Bloomberg or accounting data. This course teaches you basic methods on how to use this data.
We focus not only on the analytical part but also on the dirty secret behind data analysis: data preparation and cleaning. The course uses case studies that allow students to implement each new technique themselves.
Module two:
Data Extraction/Cleaning
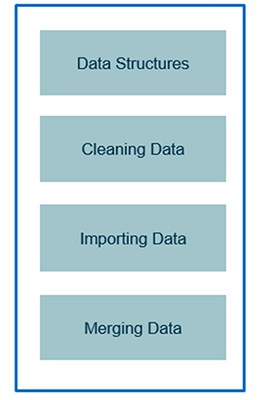
What is the most demanding aspect of Data Analysis? If you talk to experienced practitioners, eighty percent of any project is spent on getting data, cleaning, merging it with other data and similar tasks.
In recent years a lot of data has also been made available in form of APIs. Twitter or the OECD are just some institutions to do so. We will explain to you what this is and how you can use it in your analysis. Once you have all your data, how do you merge it together?
Module three:
Data Analytics
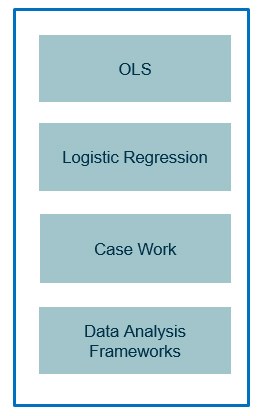
This module is the core of our data analytics module – here we will introduce the most widely tools that are used today: OLS and logistic regression. If those names ring a bell, that is intentional. You have seen them before in your education.
What we will add here is to show you how to actually use them in a practical way to solve business problems. A large emphasis in this module will be on helping you to do your analysis by solving cases.
Module four: Visualization
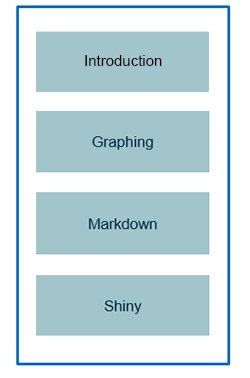
Once you have completed your analysis we will show you how to present it to others. Modern data analysis has many powerful tools that will do that:
- We will show you how to do advanced plotting and and we will teach you ways how you can do this directly out of R.
- Markdown is a simple tool that allows you to generate reports directly from within R.
- Finally, we will show you how to use the Shiny framework to build analysis tools for co-workers that don’t have the time to do their own analysis.